Week 1 — Basics of 2D Drawing
Basic Structure
- Any P5js sketch contains a setup and a draw function.
- draw loops whatever is written in it.
- createCanvas makes the canvas of the given size.
- createCanvas(400, 400) creates a canvas of width 400px and height 400px.
- background(r,g,b) sets the background color of the canvas
- If background() is called in draw, a background of given color is drawn every frame.
Primitives
Creating a point
point(x-coordinate, y-coordinate);Creating a line
line(start-X-coord, start-Y-coord, end-X-coord, end-Y-coord)Creating a rectangle
rect(X-topLeft, Y-topLeft, width, height);Creating a quadrilateral
quad(xtopLeft, ytopLeft, xtopRight, ytopRight, xbottomRight, ybottomRight, xbottomLeft, ybottomLeft);Creating a triangle
triangle(firstPointX, firstPointY, secondPointX, secondPointY, thirdPointX, thirdPointY);Creating an ellipse
ellipse(positionX, positionY, width, height);- for circle width=height
Creating an arc
arc(centerX, centerY, width, height, startAngle, endAngle, optionalparm);- the options for optionalparm are CHORD and PIE
- Without the optional argument, the arc’s perimeter is not closed.
- Optional CHORD makes a closed curve, but the shape isn’t a sector.
- Optional PIE makes a closed curve, and the shape is a sector.
Some other functions
- noFill() doesn’t fill the shape with any color.
- fill(r,g,b) defines the fill color.
- noStroke() disables the outlines for the shapes.
- stroke(r,g,b) sets the stroke color.
- strokeWeight(value) defines the thickness of the stroke
Example sketches
The p5 sketches for this week, from the course repo.
Basics — shapes and stuffrepo ↗
function setup() {
  createCanvas(800,500);
}

function draw() {
  background(255);
  noFill();
  strokeWeight(3);
  rect(20,20,200,200);
  ellipse(400,120,200,200);
  line(600,20,600,220);
  triangle(20,240,220,240,110,420);
  arc(400,240,200,200,0,PI);
  quad(720, 18, 650, 124, 650, 470, 720, 335);

  point(600,260);
}
Anatomy of a function — pointrepo ↗
function setup() {
  createCanvas(400, 400);
  strokeWeight(10);
}

function draw() {
  background(220);
  // point(x-coordinate, y-cordinate);
  point(10,10); //topLeft
  point(390,10); //topRight
  point(10,390); //bottomLeft
  point(390,390); //bottomRight
}
Anatomy of a function — linerepo ↗
function setup() {
  createCanvas(400, 400);
}

function draw() {
  background(220);
  //line(start-X-coord, start-Y-coord,
  //     end-X-coord, end-Y-coord)
  line(0,0,400,400);
}
Anatomy of a function — rectanglerepo ↗
function setup() {
  createCanvas(400, 400);
  // To center the rectangle without math
  rectMode(CENTER);
}

function draw() {
  background(100);
  // rect(X-topLeft, Y-topLeft
  //      width, height);
  //rect(200,200,100,100);
  // Quadrilateral

  // quad(x1,y1,x2,y2,x3,y3,x4,y4);

  // quad(xtopLeft, ytopLeft,
  //      xtopRight, ytopRight,
  //      xbottomRight, ybottomRight,
  //      xbottomLeft, ybottomLeft);

  quad(10,10,200,10,390,390,200,390);
}
Anatomy of a function — trianglerepo ↗
function setup() {
  createCanvas(400, 400);
}

function draw() {
  background(220);
  // triangle(firstPointX, firstPointY,
  //          secondPointX, secondPointY,
  //          thirdPointX, thirdPointY);
  triangle(200,10,
          10,390,
          390,390);
}
Anatomy of a function — ellipserepo ↗
function setup() {
  createCanvas(400, 400);
}

function draw() {
  background(100);
  // ellipse(positionX, positionY,
  //         width, height);
  // for circle width=height
  ellipse(200,200,150,100);
}
Anatomy of a function — arcrepo ↗
function setup() {
  createCanvas(400, 400);
}

//let s = 0;
//let x = 1;

function draw() {
  background(220);
  // arc(centerX, centerY,
  //    width, height,
  //    startAngle, endAngle,
  //    optionalparm);

  // Optionalparm = CHORD, PIE

  // W/o optional argument,
  // the arc perimeter is not closed.
  arc(100,200,
      100,100,
      0,PI/2);

  // Optional CHORD makes a closed curve,
  // but the shape isn't sector.
  arc(200,200,
      100,100,
      0,PI/2,
      CHORD);

  // Optional PIE makes a closed curve,
  // and the shape is a sector.
  arc(300,200,
      100,100,
      0,PI/2,
      PIE);

  // s += 0.01;
  // x += 0.1;
}
Homework — Solving Sol
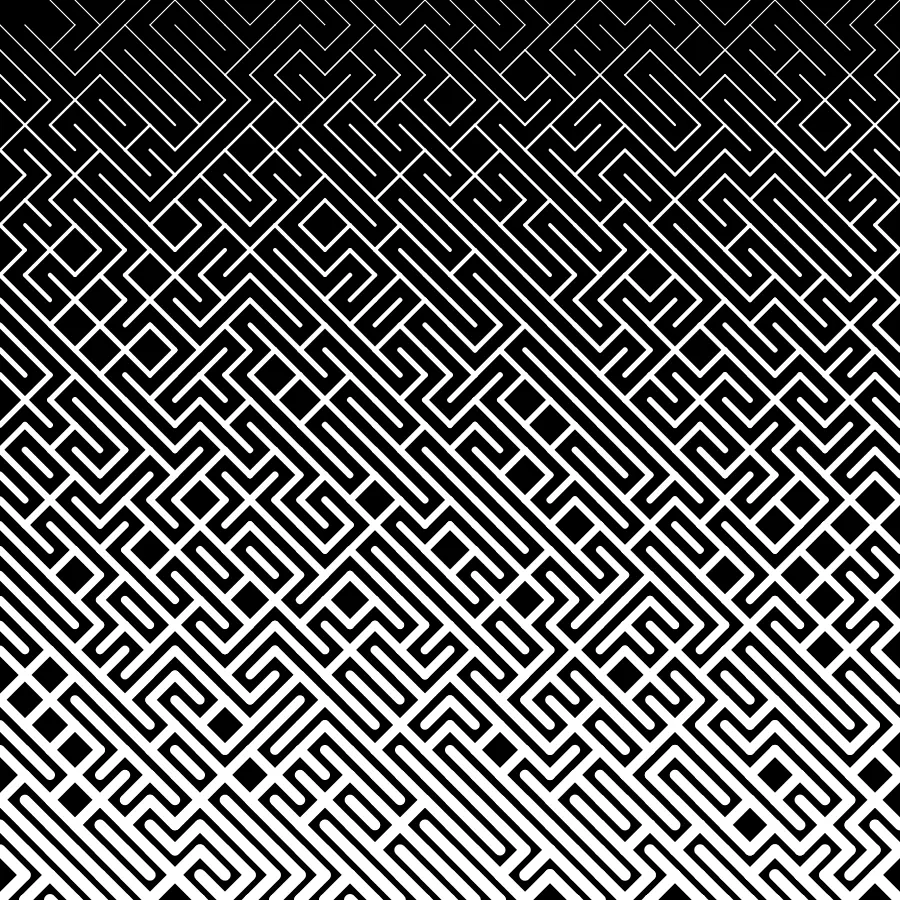
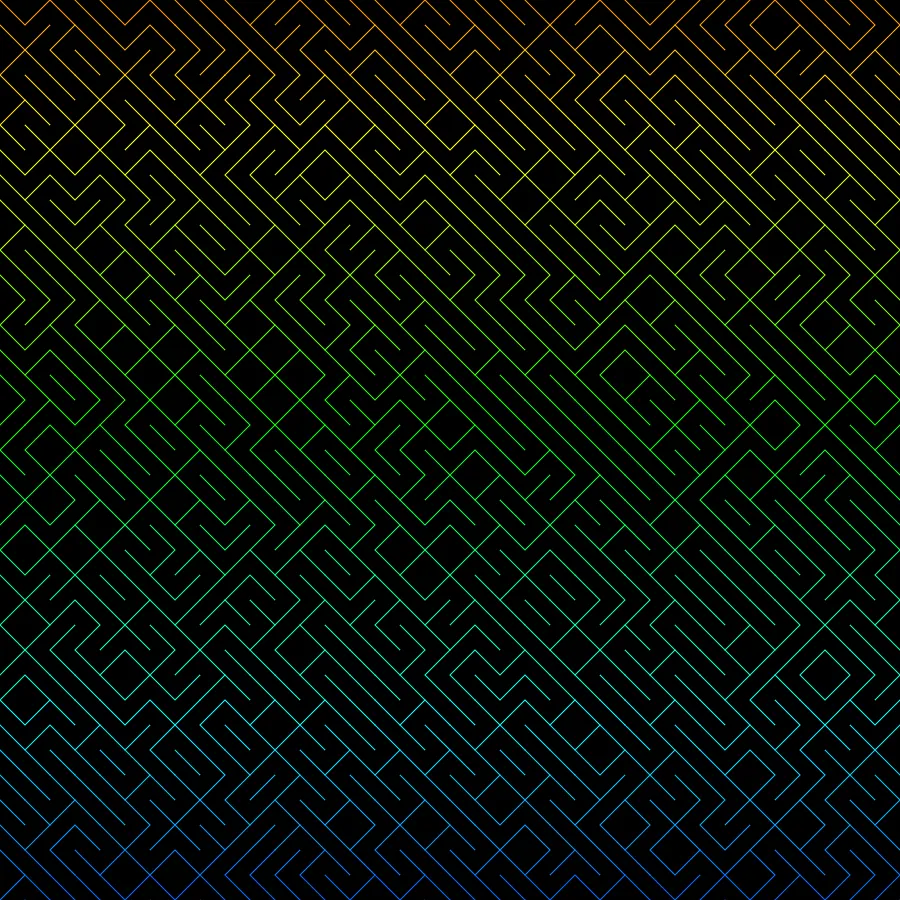
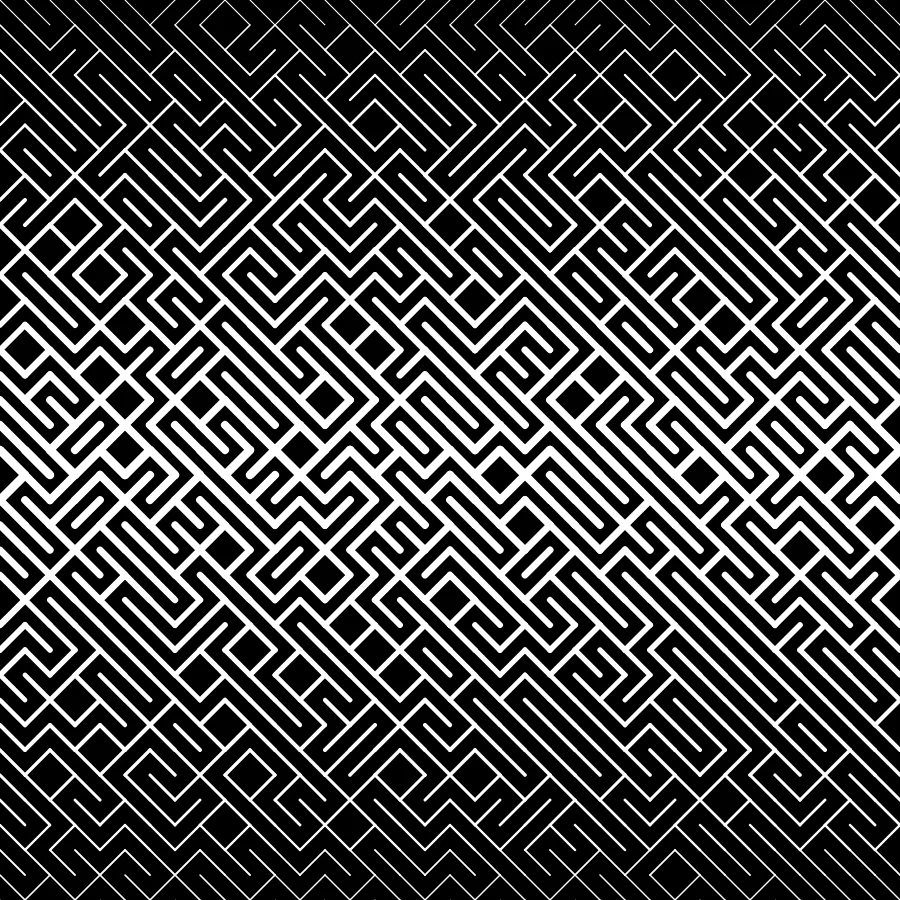
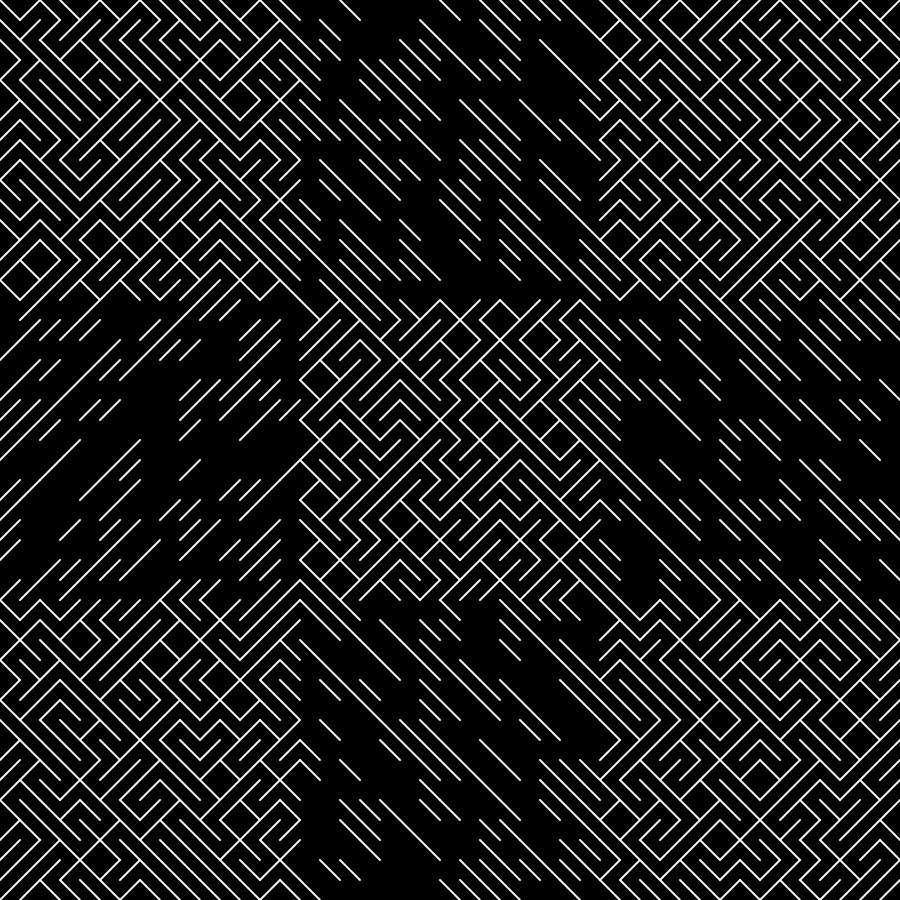
Week 1 assignment — create walls like it is showcased on Solving Sol. Some solutions. More in the repo.